Scattered Operational Updates
Service information needed to be brought into one structured view instead of remaining spread across separate reports and communication channels.
FSM
A field-service operations dashboard designed to bring workflow activity, team progress, operational status, and management reporting into one structured digital environment.
Project Overview
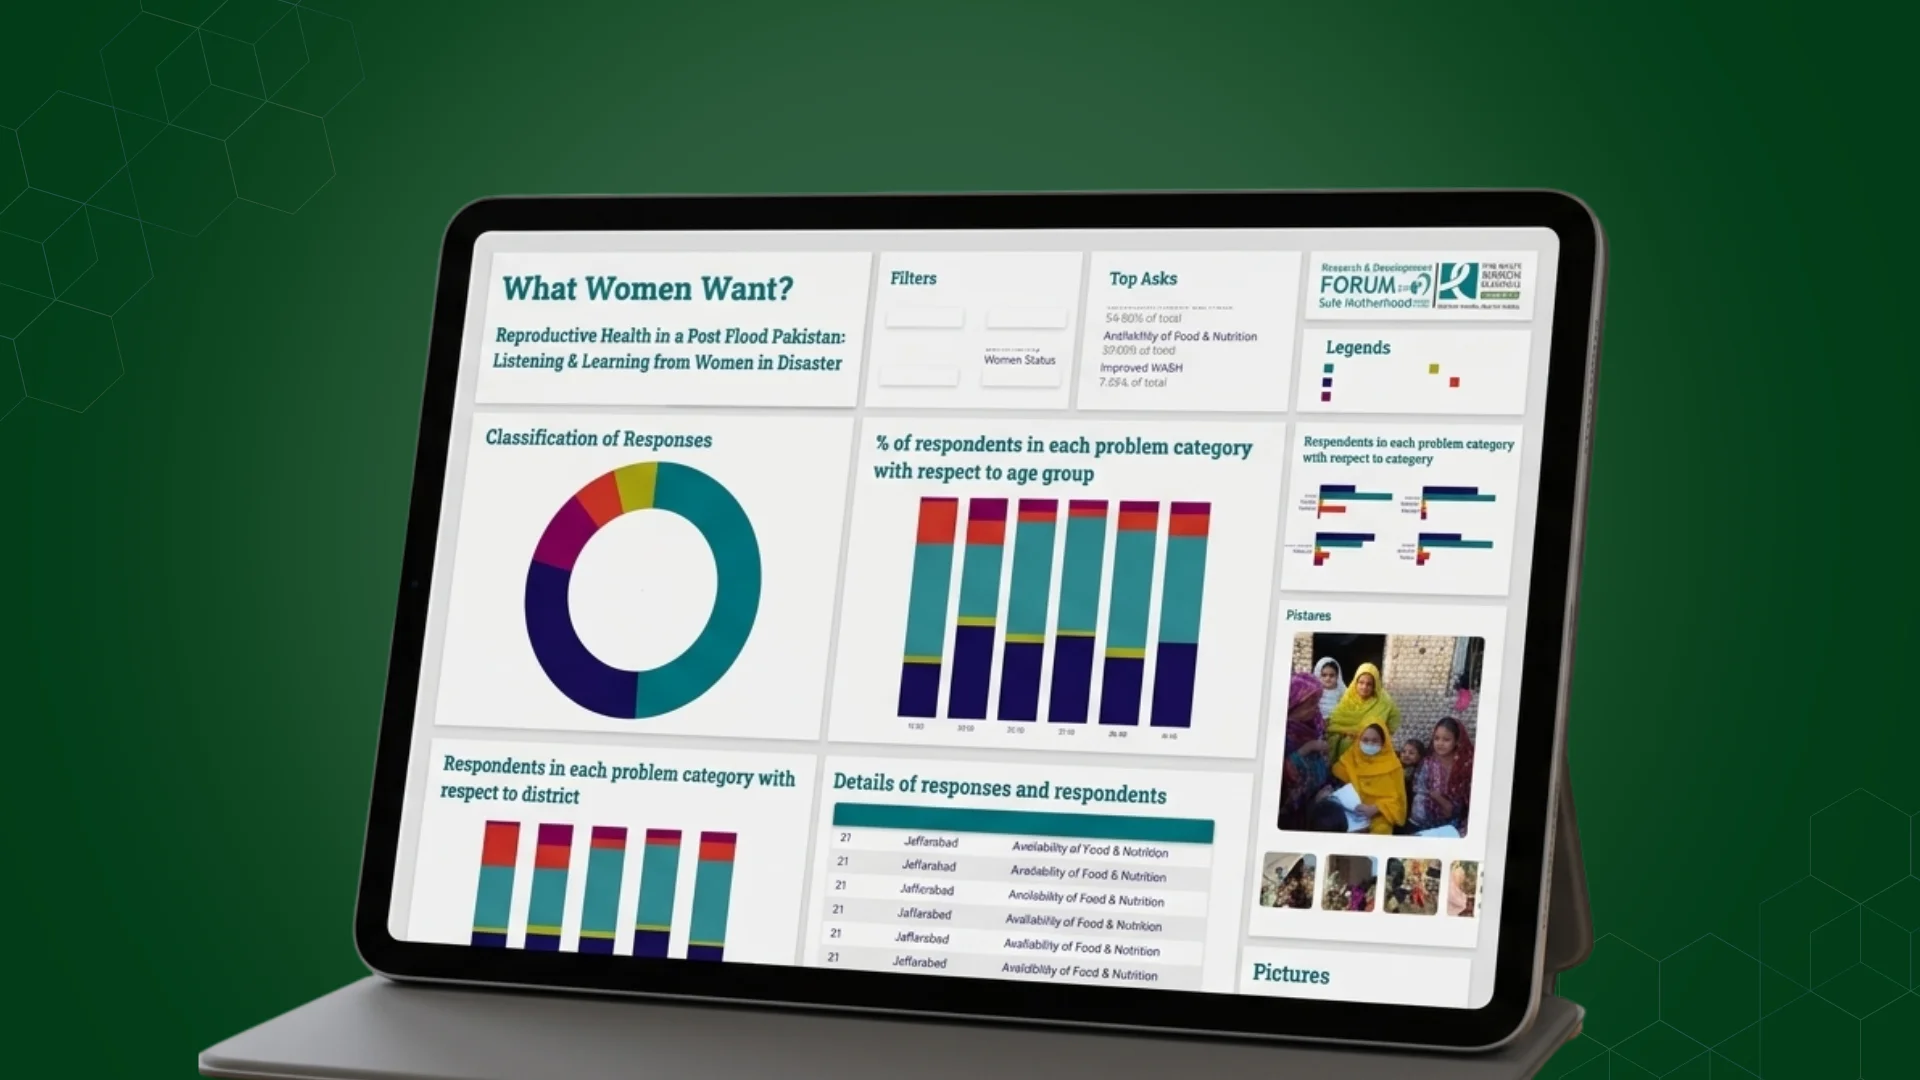
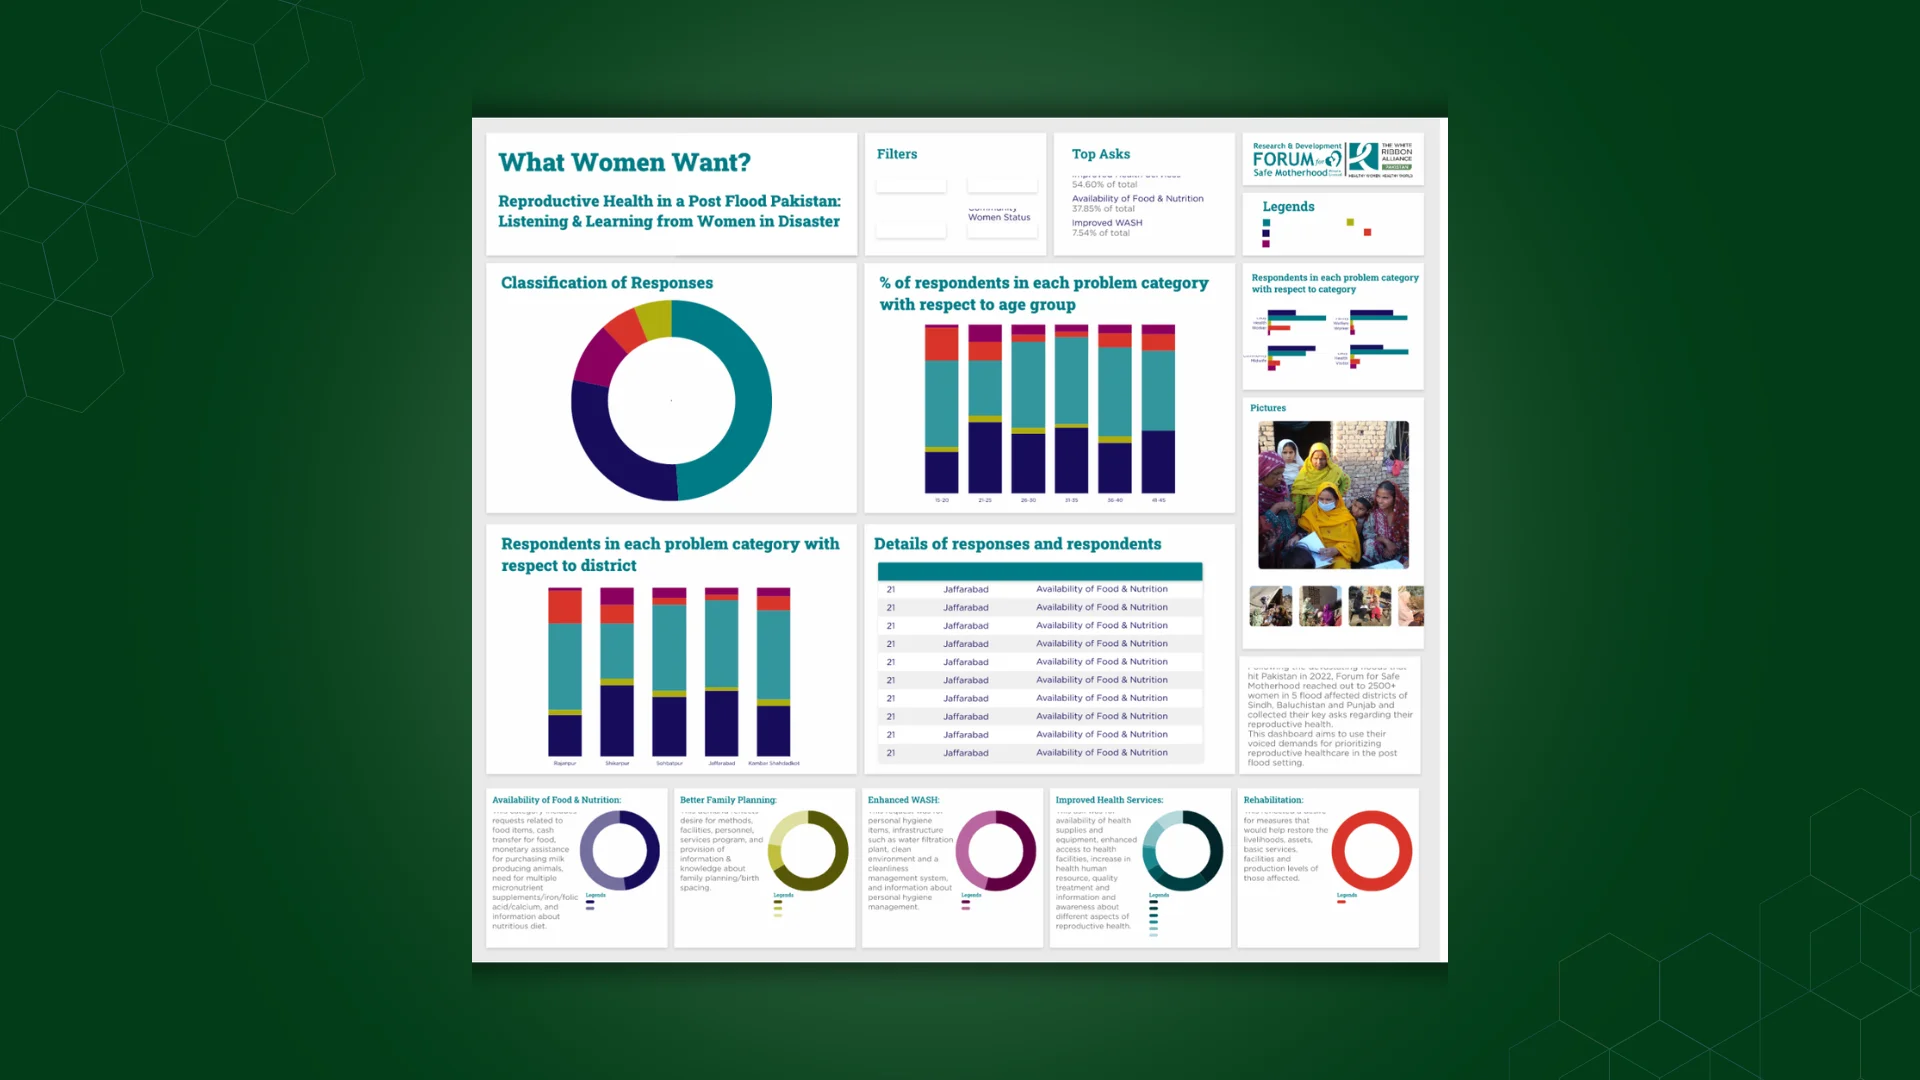
The FSM Dashboard was developed to help service teams manage operational activity through one structured digital environment. The platform brought workflow movement, team activity, service progress, and management visibility into a clearer dashboard experience, reducing the difficulty of understanding operations across scattered updates and separate reporting methods.
The Mandate
The requirement was to create a web-based dashboard that could help teams understand current activity, follow workflow progress, and monitor service operations through one organised interface. The platform needed to present operational information clearly enough for daily use while giving managers a stronger view of workload, progress, and service performance.
The Environment
Field-service operations often involve work moving across different employees, locations, workflow stages, and management levels. When updates are managed through separate tools, spreadsheets, calls, or manual reporting, teams can lose visibility into progress and responsibility. FSM needed a central dashboard that could turn operational activity into clearer and more usable management information.
Our Role
Centangle developed the FSM Dashboard as a web application focused on operational visibility and workflow management. The work involved structuring dashboard information, organising workflow views, presenting service activity clearly, and creating a digital experience that could support both service teams and operational managers.
The Challenge
Service teams require a clear view of what work is active, where activity stands, and how operations are moving across the organisation. When information is distributed across separate updates or manually prepared reports, it becomes harder to understand progress, identify delays, or maintain consistent oversight.
The challenge was to create a dashboard that could organise operational information without making the experience difficult to use. Teams needed practical workflow visibility, while management required a clearer view of service activity and performance.
Service information needed to be brought into one structured view instead of remaining spread across separate reports and communication channels.
Teams required a clearer understanding of how operational work was progressing through different stages.
Distributed service activity needed stronger visibility so users could understand current workload and operational movement.
Managers needed a more direct way to review activity without depending entirely on separately prepared updates.
The Solution
Centangle developed a structured web dashboard that brought field-service activity, workflow progress, team visibility, and management reporting into one digital environment. The platform was designed to make operational information easier to review and help service teams understand how work was moving across the organisation.
System Architecture: FSM Field Service Management Dashboard
Operational Experience
Presents service activity, workflow status, teams, performance, and reporting in one interface.
Organises service activity and workflow movement across operational stages.
Shows ongoing activity, workflow status, and operational progress.
Turns operational data into management views, summaries, and reports.
Stores field-service activity and workflow information.
Stores workflow status and progress records.
Manages user, team, and access information.
Supports dashboard summaries, reporting, and management views.
FEATURE 01
A central dashboard provides a structured overview of field-service activity, workflow movement, and operational status.
FEATURE 02
Status-based information helps teams understand how work is moving through the service process.
FEATURE 03
The dashboard presents operational activity in a way that supports clearer coordination across service teams.
FEATURE 04
Users can review current workflow status and identify areas requiring further attention.
FEATURE 05
Operational information is organised into clearer reporting views that support management review.
FEATURE 06
Dashboard layouts, summaries, and status views make field-service information easier to interpret and use.
The FSM Dashboard followed a structured delivery process focused on understanding field-service activity, organising workflow information, designing dashboard views, developing the platform, and preparing the system for operational use.
PHASE ONE
Understanding service workflows, users, operational activity, management needs, and reporting requirements.
PHASE TWO
Defining how activity, status, teams, workflow movement, and reporting information would be organised within the dashboard.
PHASE THREE
Designing operational dashboards, workflow views, team activity areas, and management reporting interfaces.
PHASE FOUR
Developing the dashboard around the approved information structure, workflow requirements, and reporting needs.
PHASE FIVE
Reviewing dashboard functionality, workflow presentation, user journeys, and reporting clarity before operational use.
The FSM Dashboard brought workflow activity, service-team information, operational status, and reporting into one structured environment, creating a clearer foundation for managing field-service operations.
Work With Us
Centangle helps organisations turn workflow activity, team progress, operational status, and reporting information into structured dashboards that are easier to understand and manage.