
Manual MEAL Processes
Monitoring, evaluation, accountability, and learning workflows needed to move from manual handling to a more structured digital system.

CARE International Pakistan
A tailored Management Information System built to automate CARE’s MEAL workflows, centralise programme data, and improve visibility across projects, beneficiaries, impact tracking, complaints, and reporting dashboards.
PROJECT OVERVIEW
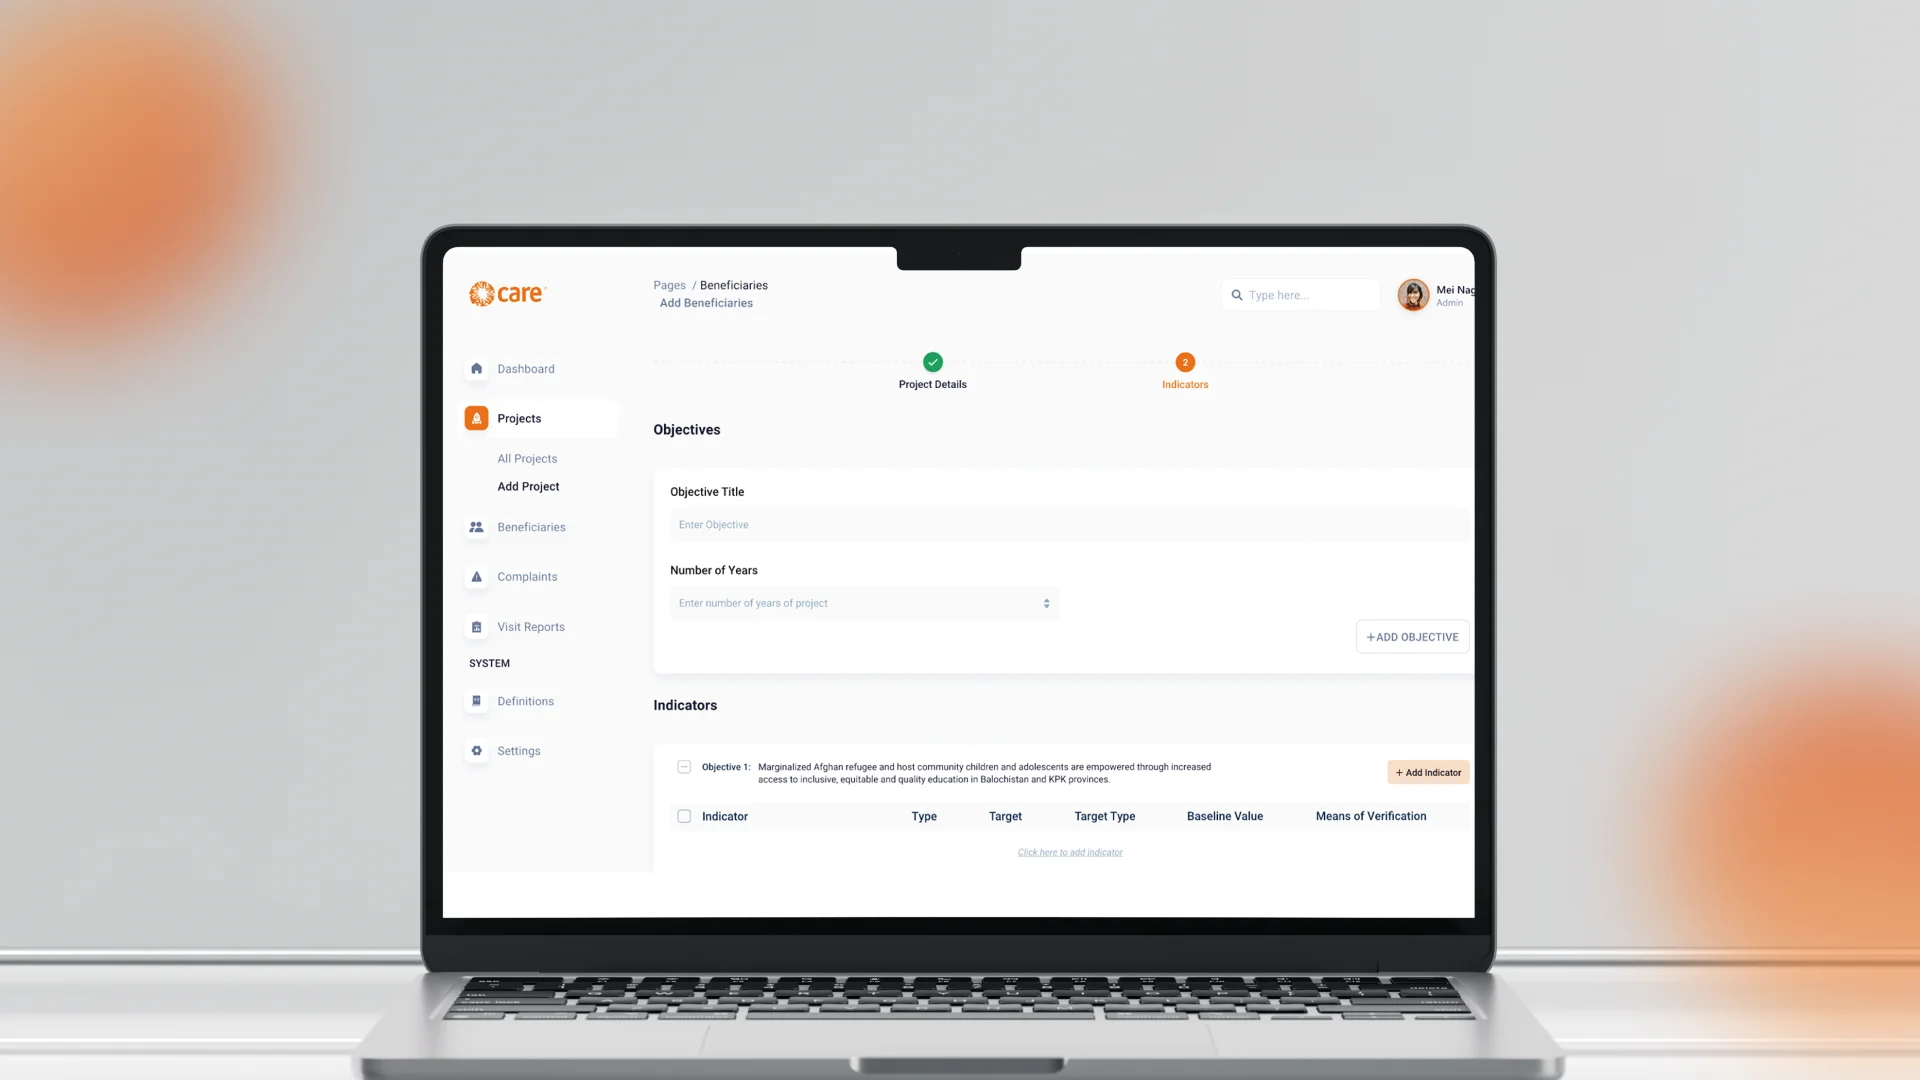
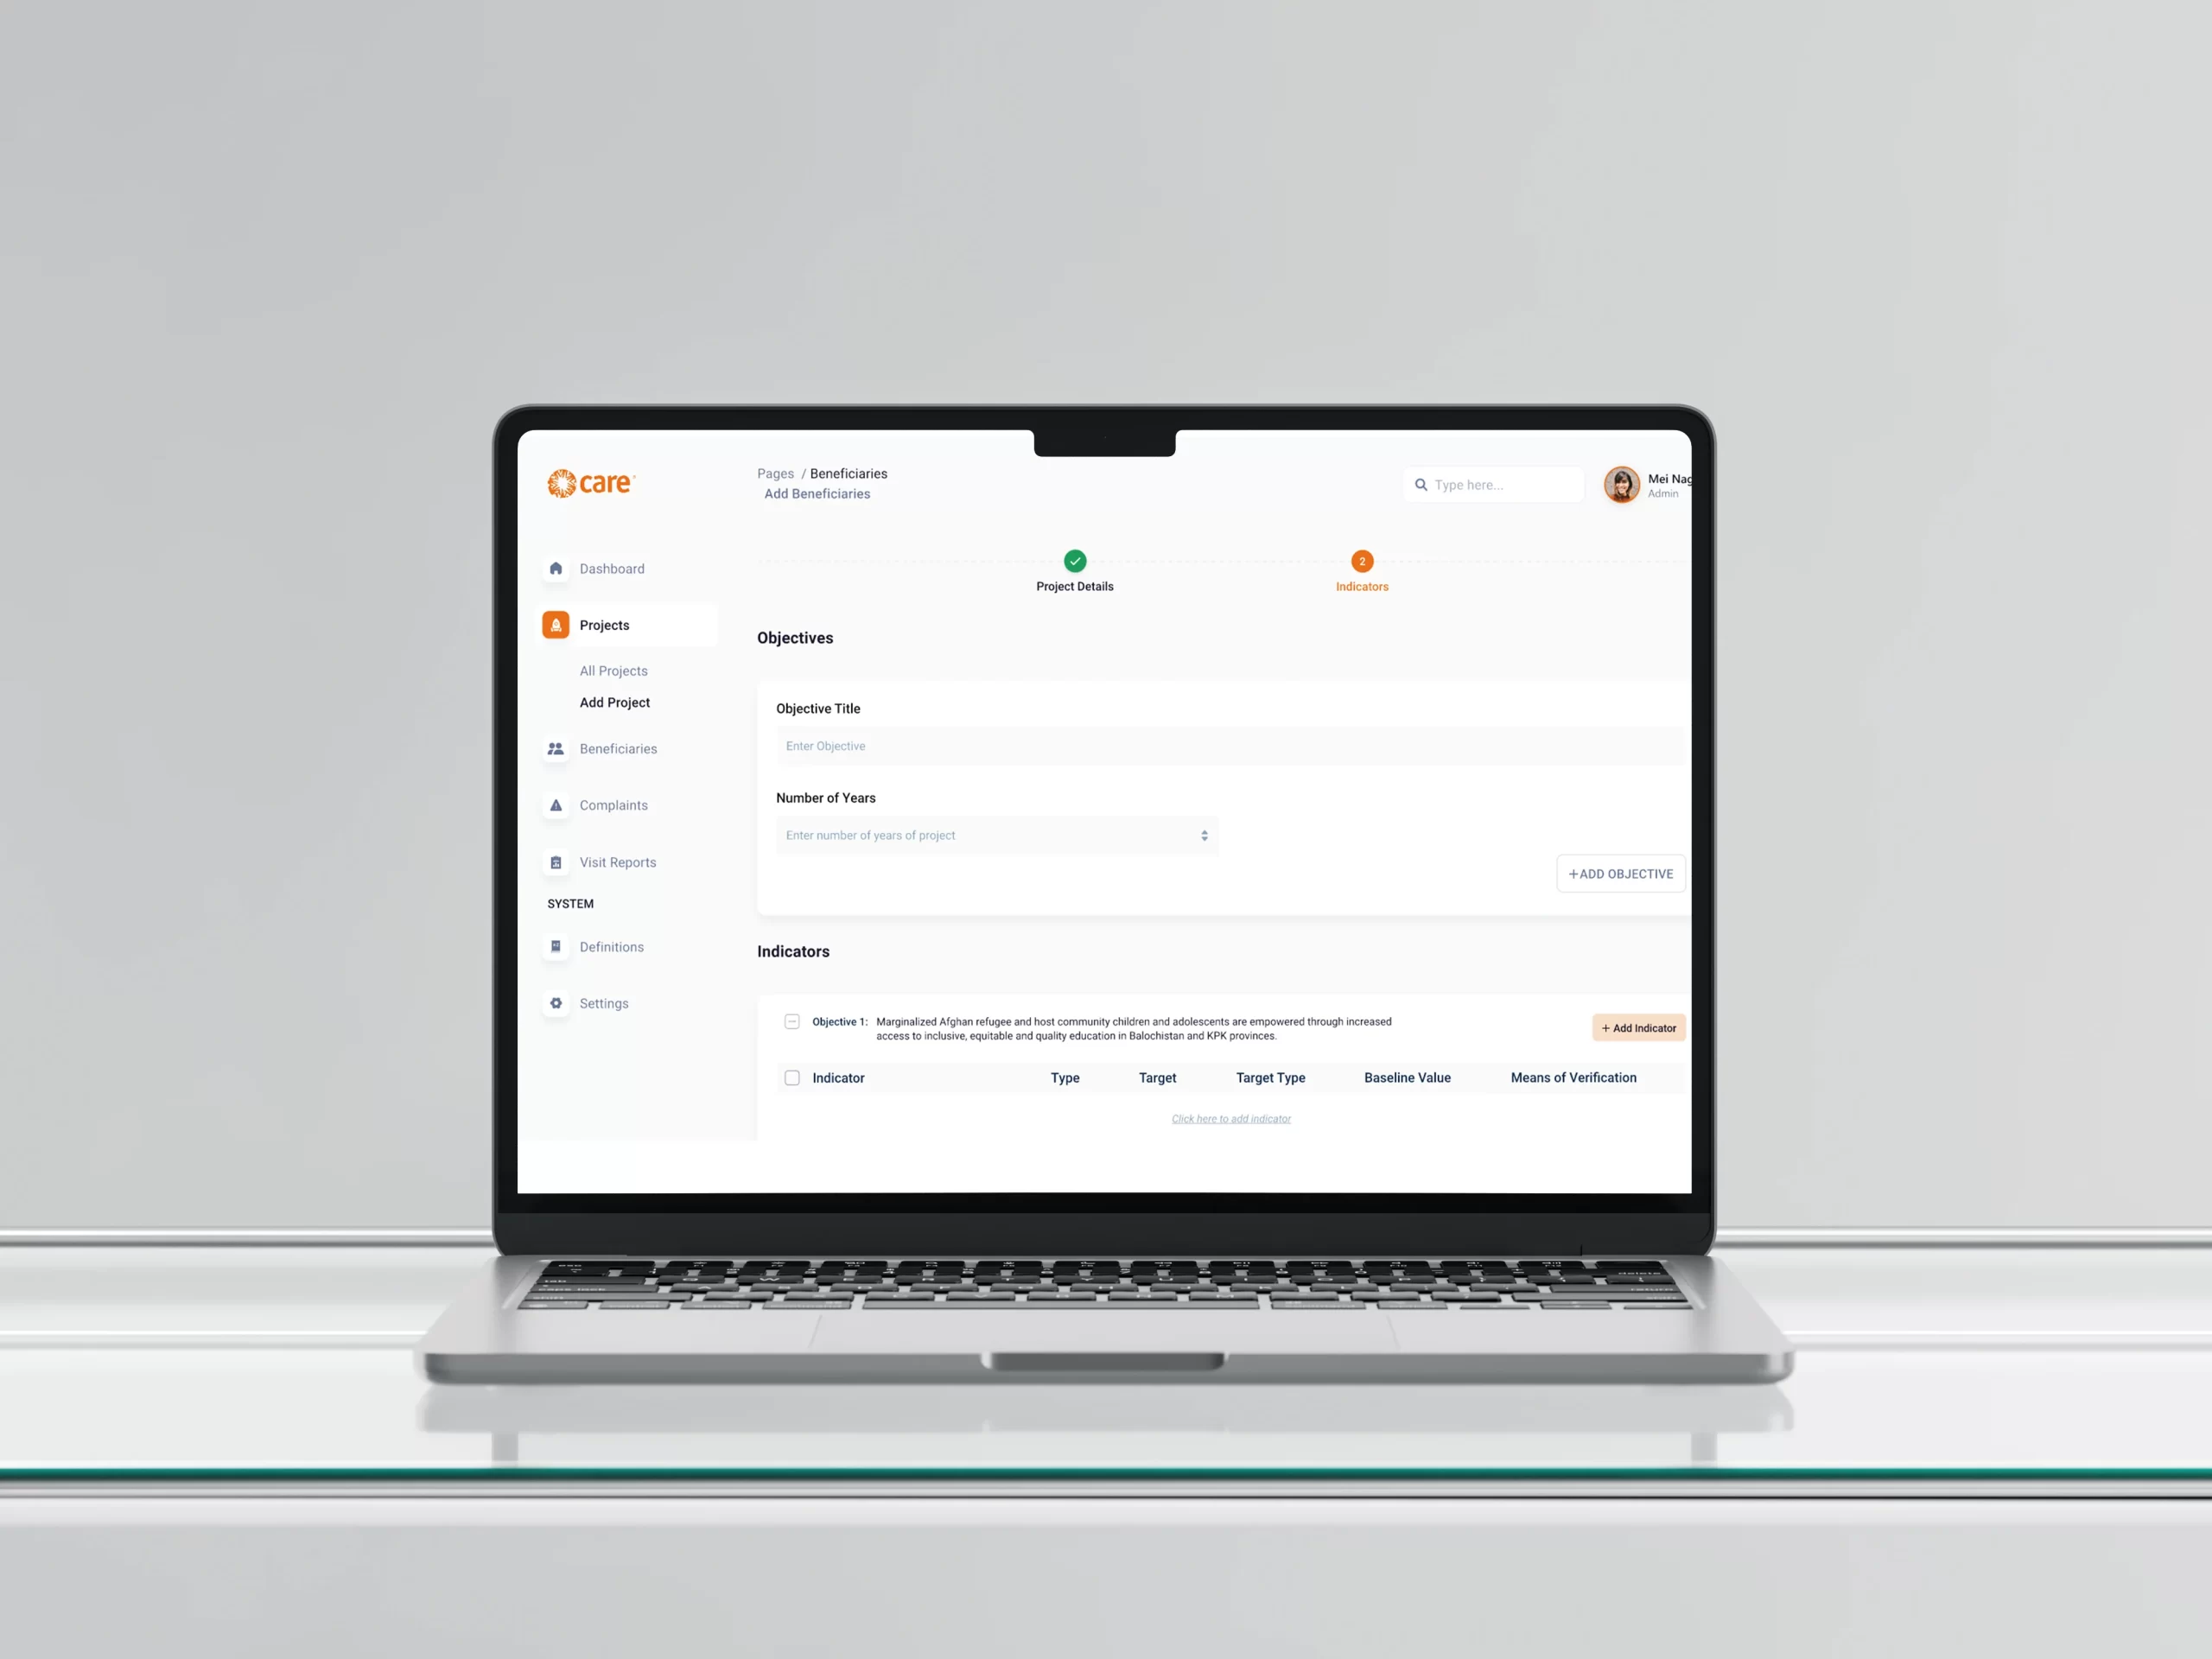
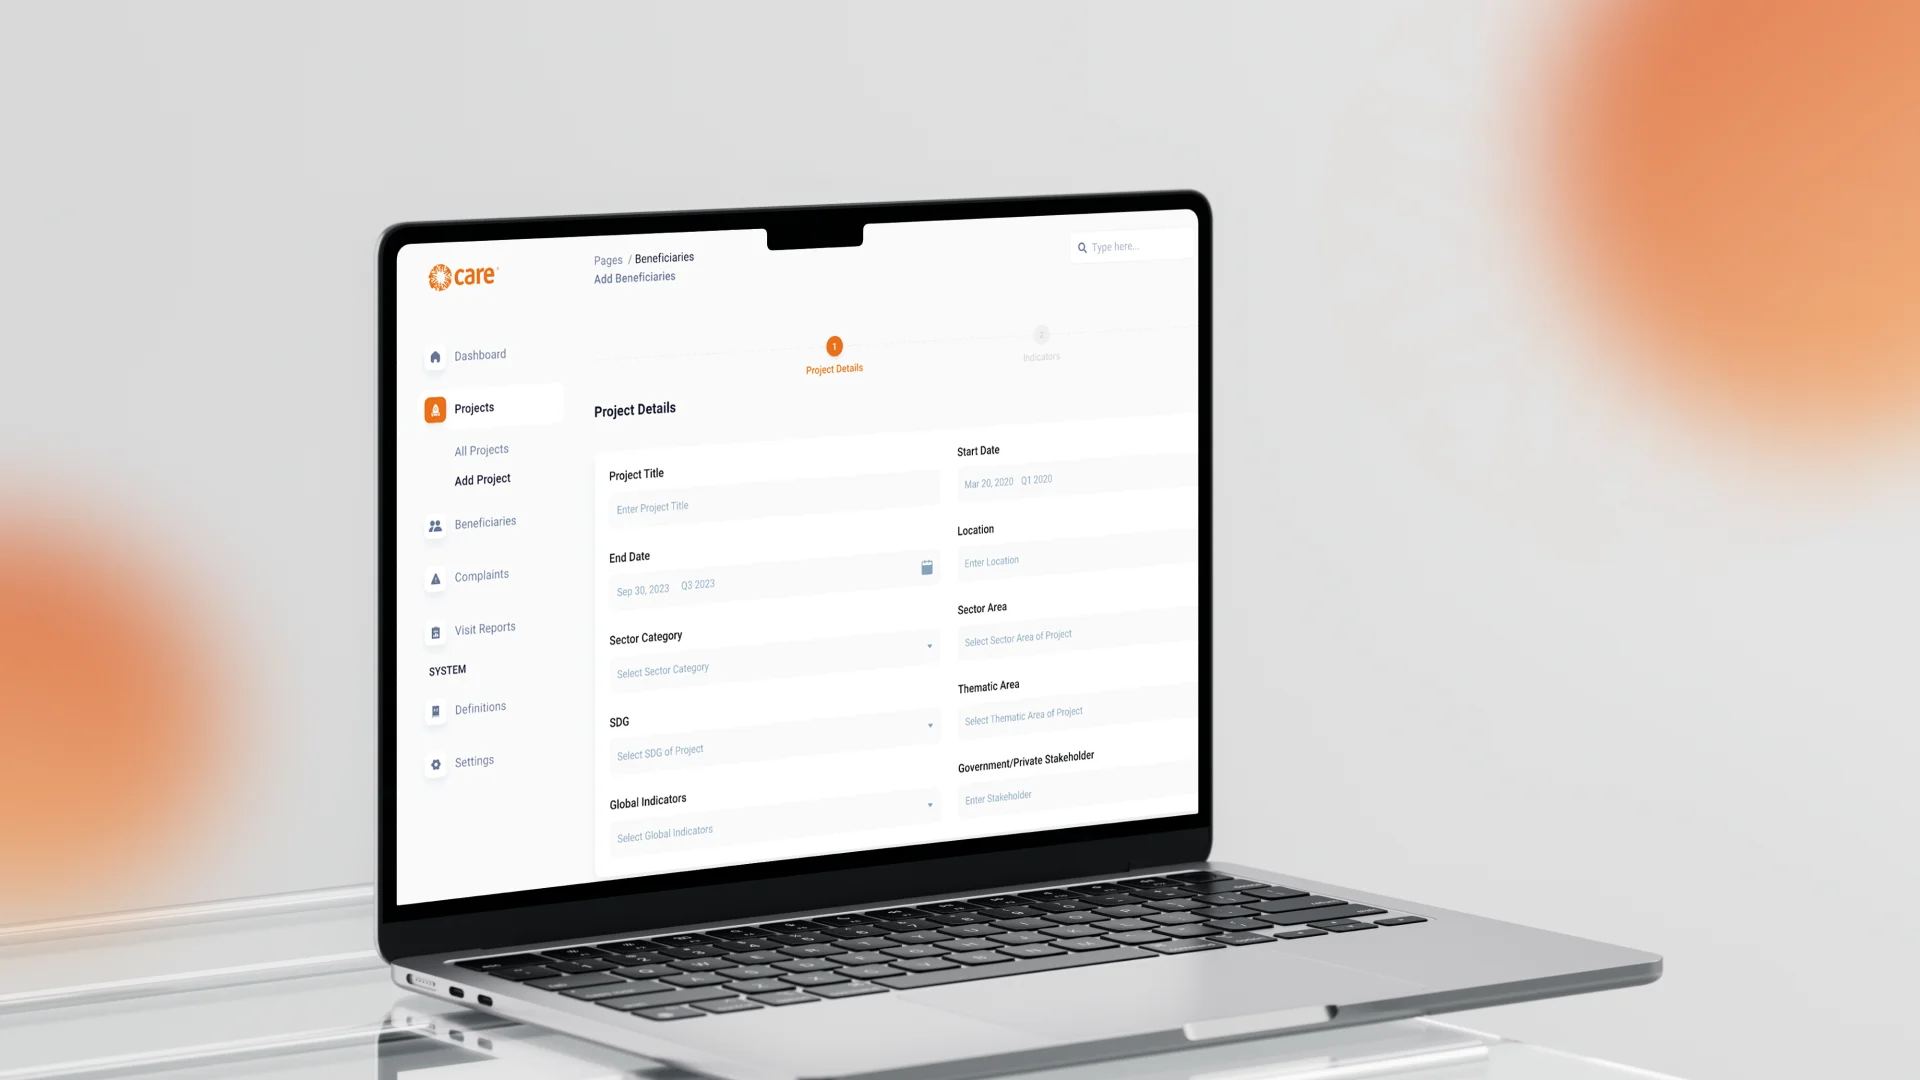
CARE needed a customised Management Information System that could automate its Monitoring, Evaluation, Accountability, and Learning process. The system needed to improve efficiency, reduce manual handling, and align project monitoring workflows with organisational goals. Centangle designed and developed a tailored MIS that brought project dashboards, impact tracking, beneficiary distribution, geographic activity views, participant records, complaints management, activity monitoring, and reporting dashboards into one structured platform.
The Mandate
CARE required a digital system that could move MEAL workflows away from manual handling and into a more structured, automated, and dashboard-led environment. The MIS needed to support project tracking, beneficiary visibility, participant records, complaints management, impact reporting, activity monitoring, geographic distribution, and management dashboards. The objective was to create a system that could help CARE monitor programme progress, compare actual performance with targets, review beneficiary reach, and access reporting insights through one connected platform.
The Environment
CARE’s MEAL process involved multiple layers of project monitoring, beneficiary tracking, impact measurement, complaints, activities, and reporting. Without a tailored MIS, these workflows could become difficult to manage across separate files, manual processes, and disconnected reporting formats. CARE needed a system that could centralise project data, reduce manual effort, support reporting accuracy, and give teams a clearer view of programme performance across activities, beneficiaries, locations, and impact areas.
Our Role
Centangle designed and developed CARE’s Management Information System as a custom MEAL process automation platform. The work included research, stakeholder discussions, user interviews, system architecture, UI/UX design, web application development, dashboard development, database management, reporting structures, and maintenance support. The final system helped CARE automate monitoring workflows, organise programme data, review performance, and use dashboards for faster management visibility.
The Challenge
CARE’s MEAL process involved multiple layers of project monitoring, beneficiary tracking, impact measurement, complaints, activities, and reporting. Without a tailored MIS, these workflows could become difficult to manage across separate files, manual processes, and disconnected reporting formats.
This made it harder to track progress, compare actual performance against targets, review beneficiary distribution, and maintain a clear view of programme activity. The challenge was to design a system that could automate CARE’s MEAL process while keeping the experience simple, structured, and aligned with organisational goals.
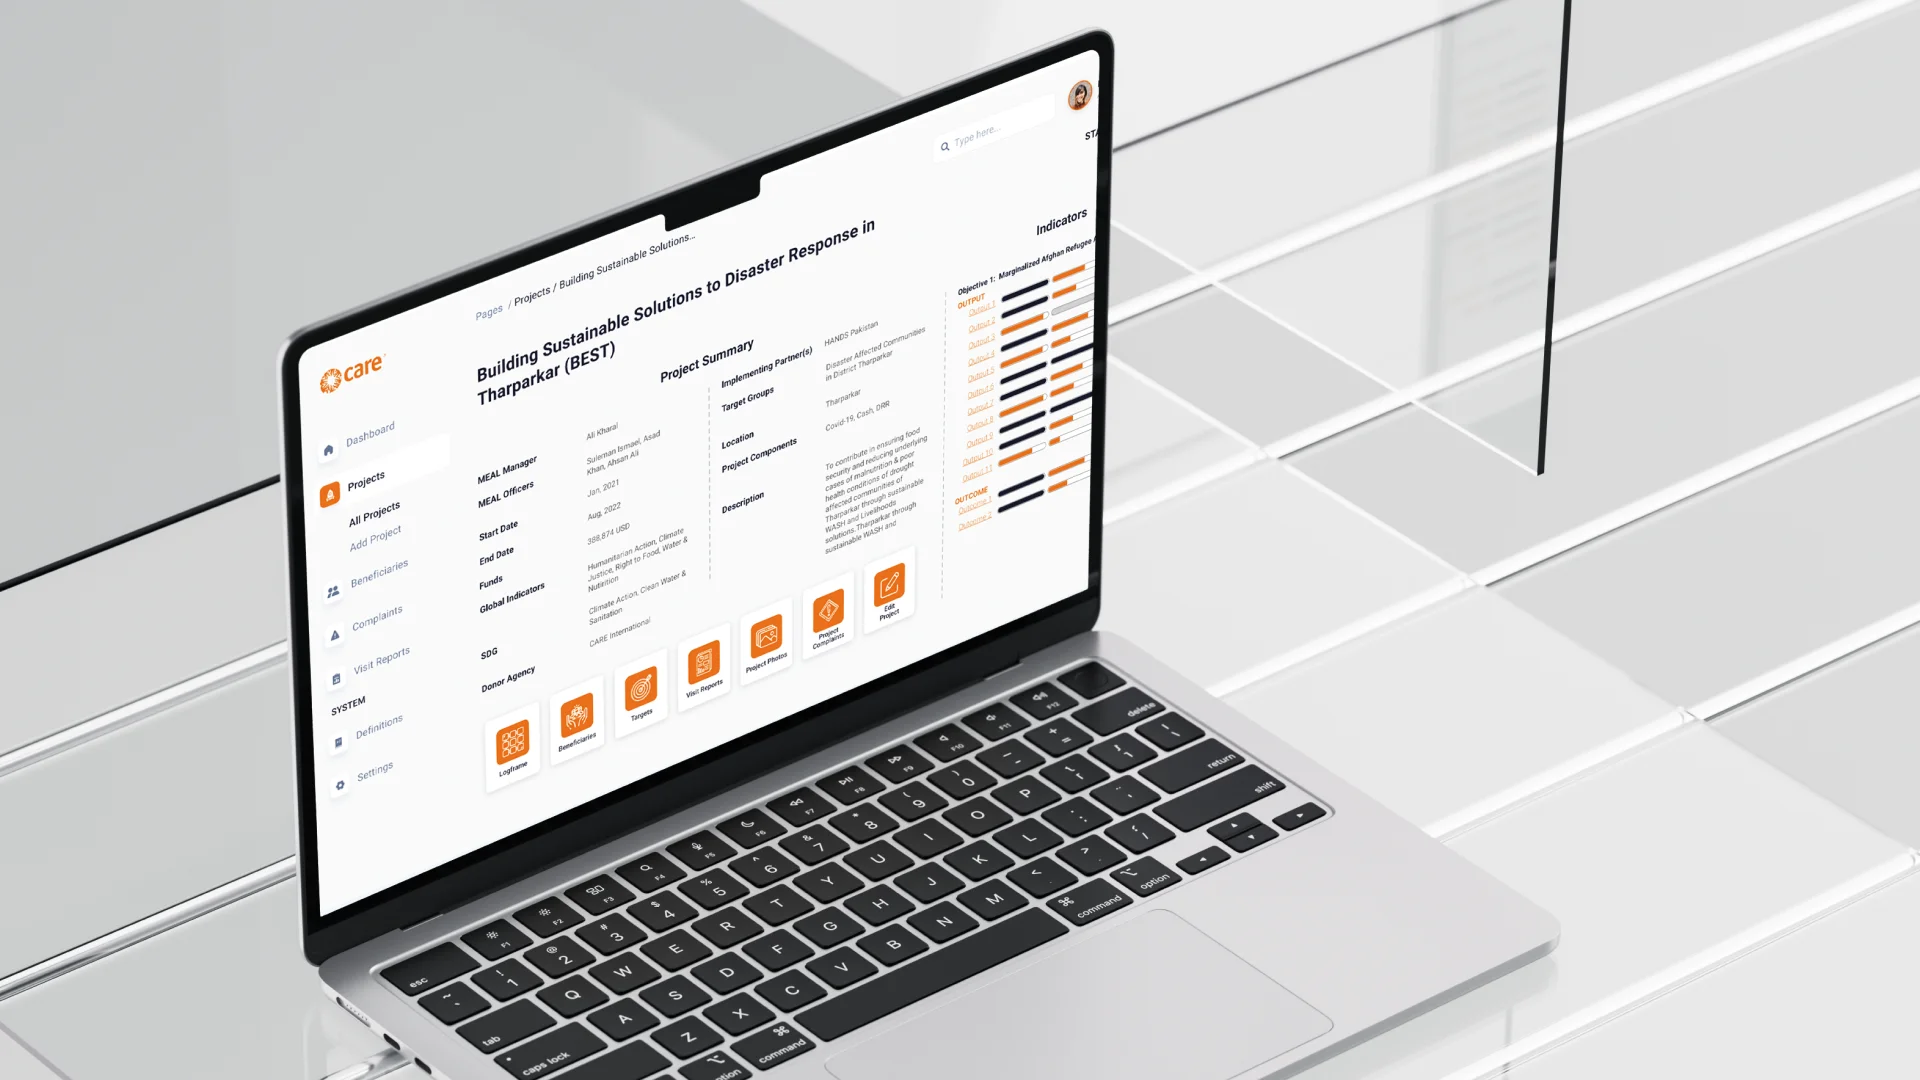
Monitoring, evaluation, accountability, and learning workflows needed to move from manual handling to a more structured digital system.
Project performance, beneficiary data, activities, and impact indicators needed to be viewed from one place.
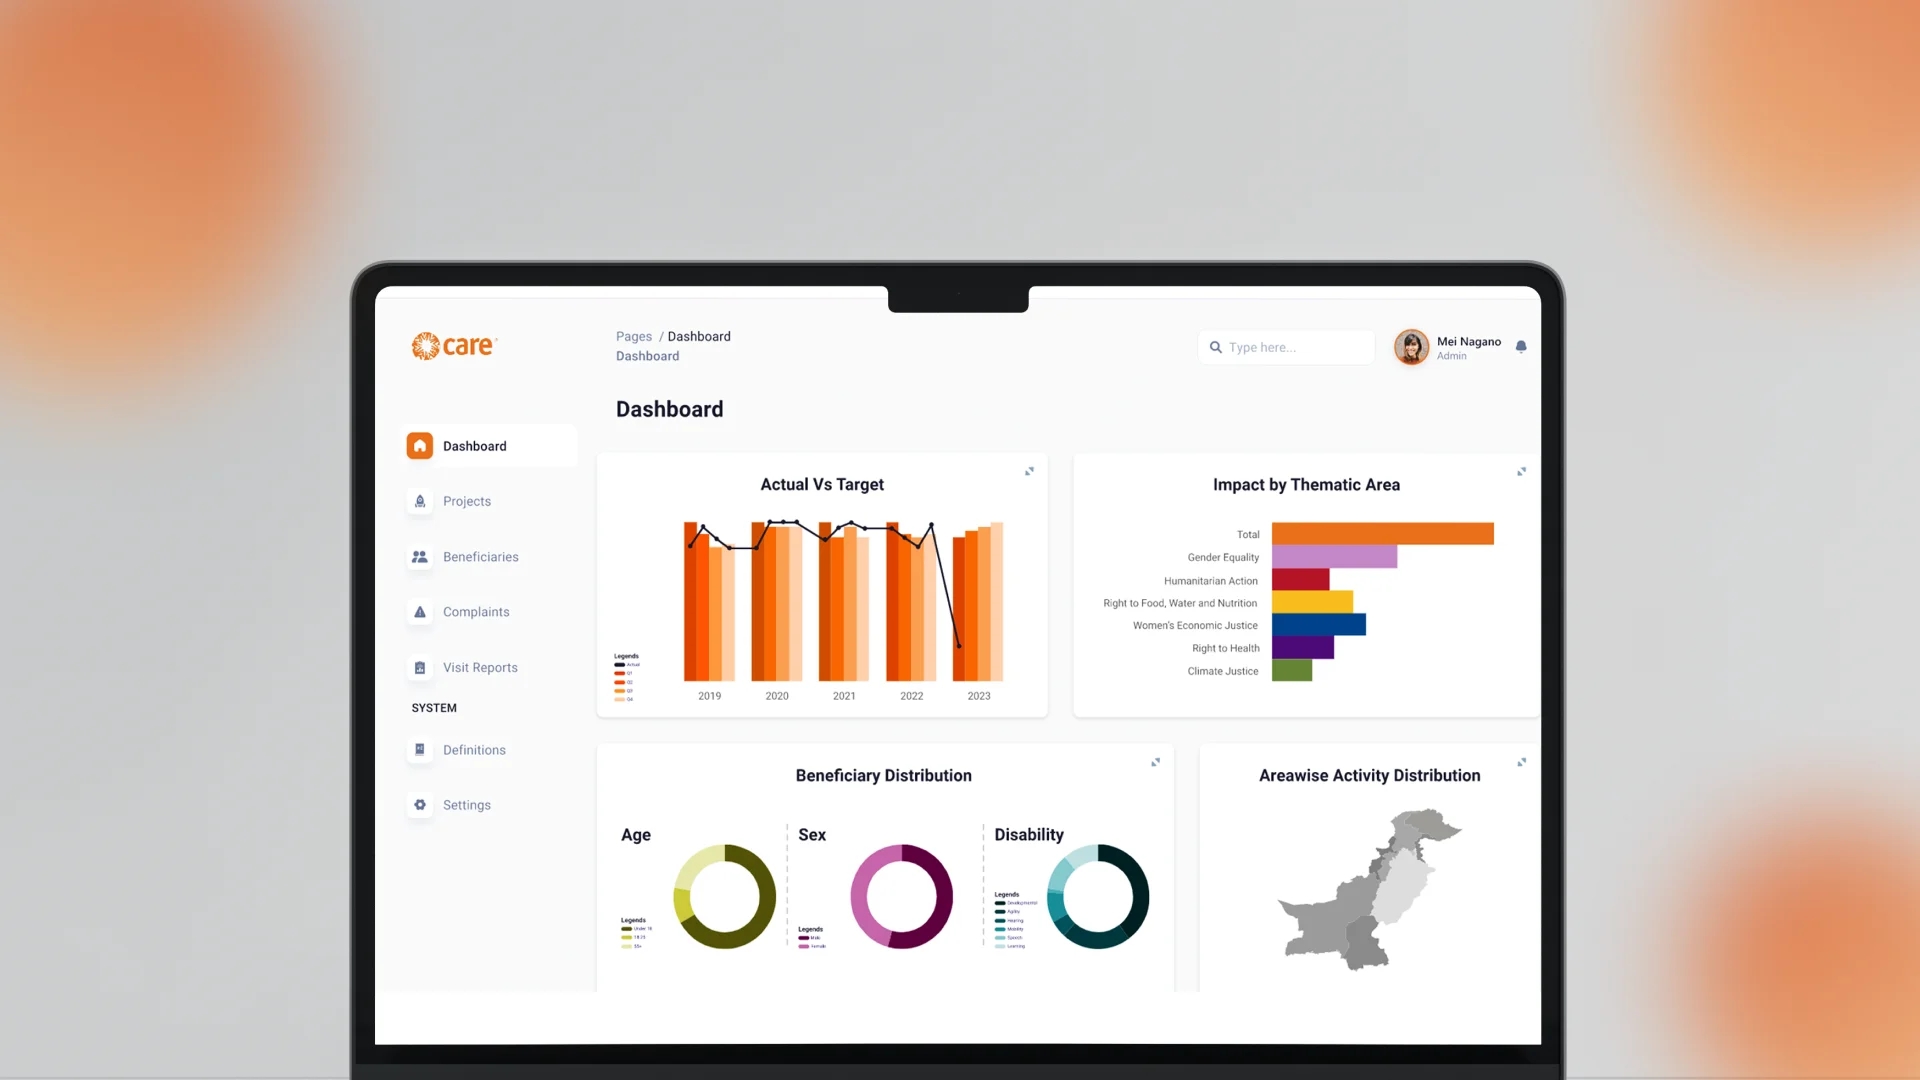
CARE needed dashboards that could present actual versus target performance, impact by thematic area, beneficiary distribution, and geographic activity.
The system needed to organise beneficiary and participant data so reach, coverage, and distribution could be reviewed more clearly.
The Solution
Centangle designed and developed a custom MIS for CARE that brought MEAL workflows, project monitoring, beneficiary records, complaints, impact data, geographic activity, and reporting dashboards into one connected platform, helping teams move from manual tracking and scattered files to a clearer digital system for monitoring progress, comparing targets with actual performance, reviewing beneficiary distribution, and accessing programme insights through structured dashboards.
SYSTEM ARCHITECTURE — CARE MIS
Programme + MEAL UI
Project overview · Progress tracking · KPI visibility · Reporting summaries
Project monitoring · Actual versus target tracking · Impact area management · Activity tracking
Complaint logging · Case tracking · Review process · Accountability follow-up
Dashboard views · Performance summaries · Geographic activity review · Management reporting
Project data · Beneficiary records · Participant information · Activity records
Impact tracking · Beneficiary distribution · Programme coverage · Thematic analysis
Visual dashboards · Reporting outputs · Progress summaries · Performance insights
FEATURE 01
A central MEAL dashboard showing project activity, progress indicators, reporting summaries, and performance status, giving teams one place to monitor programme movement.
FEATURE 02
Thematic impact views help CARE monitor programme outcomes, priority areas, and field-level progress without relying on scattered manual updates.
FEATURE 03
Dashboard-based reporting compares planned targets with achieved progress, making performance gaps, delivery movement, and reporting priorities easier to review.
FEATURE 04
Structured beneficiary views show reach, coverage, and distribution patterns across programme areas, helping teams understand who is being served and where.
FEATURE 05
Location-based activity views show how programme work is distributed across areas, giving teams clearer visibility into field activity and geographic coverage.
FEATURE 06
A structured accountability workflow records, reviews, and tracks complaints within the MIS, helping teams manage follow-ups and keep complaint information organised.
The CARE MIS was delivered through a research-led process focused on understanding MEAL workflows, gathering user requirements, structuring system architecture, designing dashboards, and developing a tailored MIS within a four-month timeline.
PHASE ONE
Understanding CARE’s MEAL process, user needs, stakeholder expectations, reporting requirements, and organisational goals.
PHASE TWO
Structuring how project data, beneficiaries, participants, complaints, impact areas, geographic activity, and reporting workflows would connect inside the MIS.
PHASE THREE
Designing dashboard views for project progress, impact tracking, actual versus target performance, beneficiary distribution, and geographic activity.
PHASE FOUR
Developing the platform using React, .NET, database management, dashboard development, and MEAL system architecture.
PHASE FIVE
Reviewing functionality, refining workflows, validating dashboards, and supporting the platform for operational use.
The CARE MIS helped bring project monitoring, beneficiary information, accountability workflows, complaints management, and reporting activity into one structured platform. By centralising project data and giving management access to dashboards and indicator views, the system improved visibility across project performance, field activity, beneficiary distribution, complaints, and reporting progress.
WORK WITH US
Centangle helps organisations build MIS platforms that improve programme visibility, reduce manual effort, strengthen reporting, and support better decision-making.