


From diagnostic to deployment, we bring structure and operational clarity to the environments others find too complex to modernise.
Trustpilot
Rated 4.5/5.0
Trusted By Industry Leaders
Centangle works with organisations to deliver websites, apps, dashboards, portals, MIS platforms, enterprise integrations, and long-term digital programmes with the same clarity and delivery discipline.
THE CHALLENGE
Digital problems rarely begin as major failures. They often start with small decisions: a website built without room to grow, a dashboard created without reliable data, an app launched without user clarity, or a platform added without integration.
Over time, these gaps create friction. Teams rely on manual workarounds. Reporting becomes harder to trust. Systems stop speaking to each other. Users struggle with tools that were not designed around their real workflows.
Centangle helps organisations step back, understand the system behind the need, and build forward with clarity.
Scattered data environments erode trust in reporting and decision-making, leaving leadership without a reliable view of operations.
Platforms never designed to work together create manual dependencies, operational delays, and integration debt that compounds over time.
Without governance structures, accountability for system outcomes dissolves — risk accumulates silently until it surfaces as crisis rather than a managed issue.
The Root Cause
The Impact
The Risk
Services
Seven practice areas built around how complex digital environments actually operate — not how they're sold in slide decks.

Centangle’s journey reflects more than years in business. It reflects the depth of systems designed, platforms delivered, partnerships built, and operational challenges solved across industries. From digital products and enterprise platforms to integrated technology solutions, our work has been shaped by a consistent focus on clarity, reliability, and long-term value.
Years in Business
Satisfied Clients
Project Delivered
Sectors Served
Our Solution
Our methodology aligns enterprise architecture, integration frameworks, and governance controls to reduce digital complexity and operational risk — with every control layer reinforcing the next.
Unified enterprise architecture ensures platforms, data environments, and workflows are aligned structurally rather than layered inconsistently. Structure always precedes tooling.
Defined integration pathways connect systems through structured frameworks, preventing silos and unstable connections. Interoperability is engineered in — not assumed.
Release governance, access controls, documentation standards, and compliance logic are embedded within system design — never added as an afterthought.
Structured reporting models and automated workflows give leadership real-time performance oversight and institutional control across every layer of the environment.
The Outcome

We begin by understanding the client’s goals, users, workflows, systems, risks, and technical context. This gives the project a clear foundation before design or development begins.

We translate discovery into a practical direction for design, architecture, features, integrations, governance, and delivery. The blueprint helps make decisions clearer before build work begins.
We design the product, platform, workflows, and user experience before development begins. This helps reduce rework and makes sure the solution reflects real requirements, not assumptions.
We build in structured phases, with testing, documentation, release governance, training, and post-launch support included where needed. Delivery stays aligned to the approved plan while remaining practical for real operating conditions.

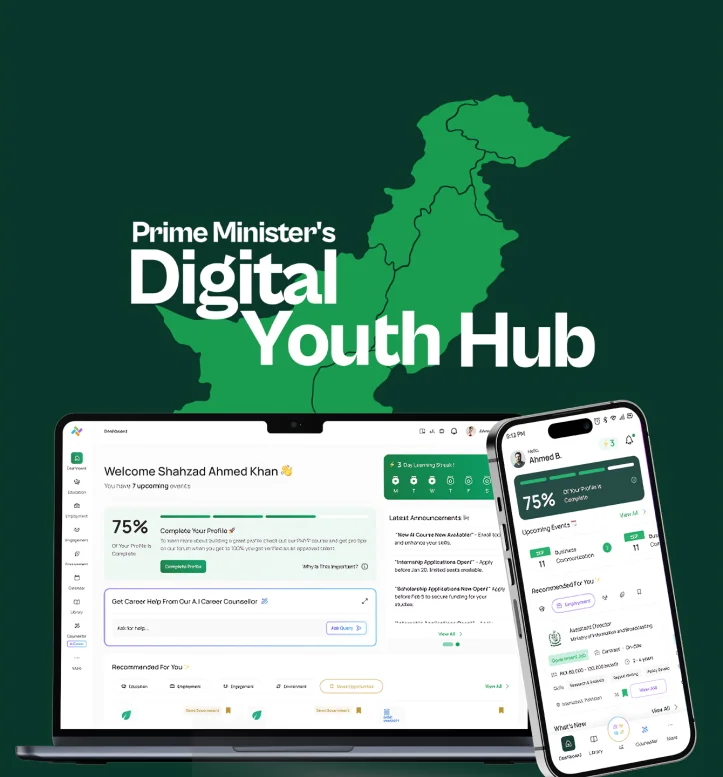
portfolio
Why Centangle
Most digital projects begin with tools. Centangle begins with the system logic behind the work: who will use it, how it will operate, what it needs to connect with, and how it should grow over time.
Our Philosophy
Digital systems rarely fail because of functionality. They fail because they were never designed to operate as one environment.
We architect interoperability from the outset not as a retrofit, but as a deliberate structural decision made before a single line of code is written.
Complex organizations do not run on clean workflows alone. They operate through dependencies, approvals, exceptions, field realities, and governance structures.
We define the logic, users, workflows, and architecture before committing to tools or development.
Our systems account for approvals, exceptions, field realities, reporting needs, and the way teams actually work.
We design platforms to connect with data, workflows, and surrounding systems instead of treating integration as an afterthought.
We build with maintainability, usability, security, and future scale in mind.
Client voices
OUR SUBSIDIARIES
Centangle AI focuses on enterprise AI systems, intelligent automation, behavioral intelligence, and scalable AI-driven operational solutions.
ARZ Intelligence focuses on Geo-Intelligence and Behavioral Intelligence, helping businesses leverage geographic data to improve decision-making, optimize site selection, and reduce operational costs.
Diran Productions specializes in high-end digital media production, visual storytelling, brand campaigns, and creative content experiences.
Blogs
Stay updated with our thoughts on technology, design, and digital innovation
Partners


Recognition
Centangle has been recognised by TechBehemoths across WordPress, software development, web delivery, and social media marketing — from 2021 through 2025.
WORK WITH US
Complex systems deserve structured thinking before execution. Engage us for a strategic discussion to assess your digital environment and define a disciplined path forward.
.png)
.png)
.png)