



3min read
Dashboards are often treated as the answer to reporting problems.
When reports are slow, data is scattered, or leadership needs faster visibility, the natural response is to build a dashboard. But a dashboard does not automatically create better decisions.
It can make information easier to see, but it cannot fix unclear data, weak reporting logic, disconnected workflows, or undefined ownership on its own. If the structure behind the dashboard is weak, the dashboard only makes the problem look more organised.
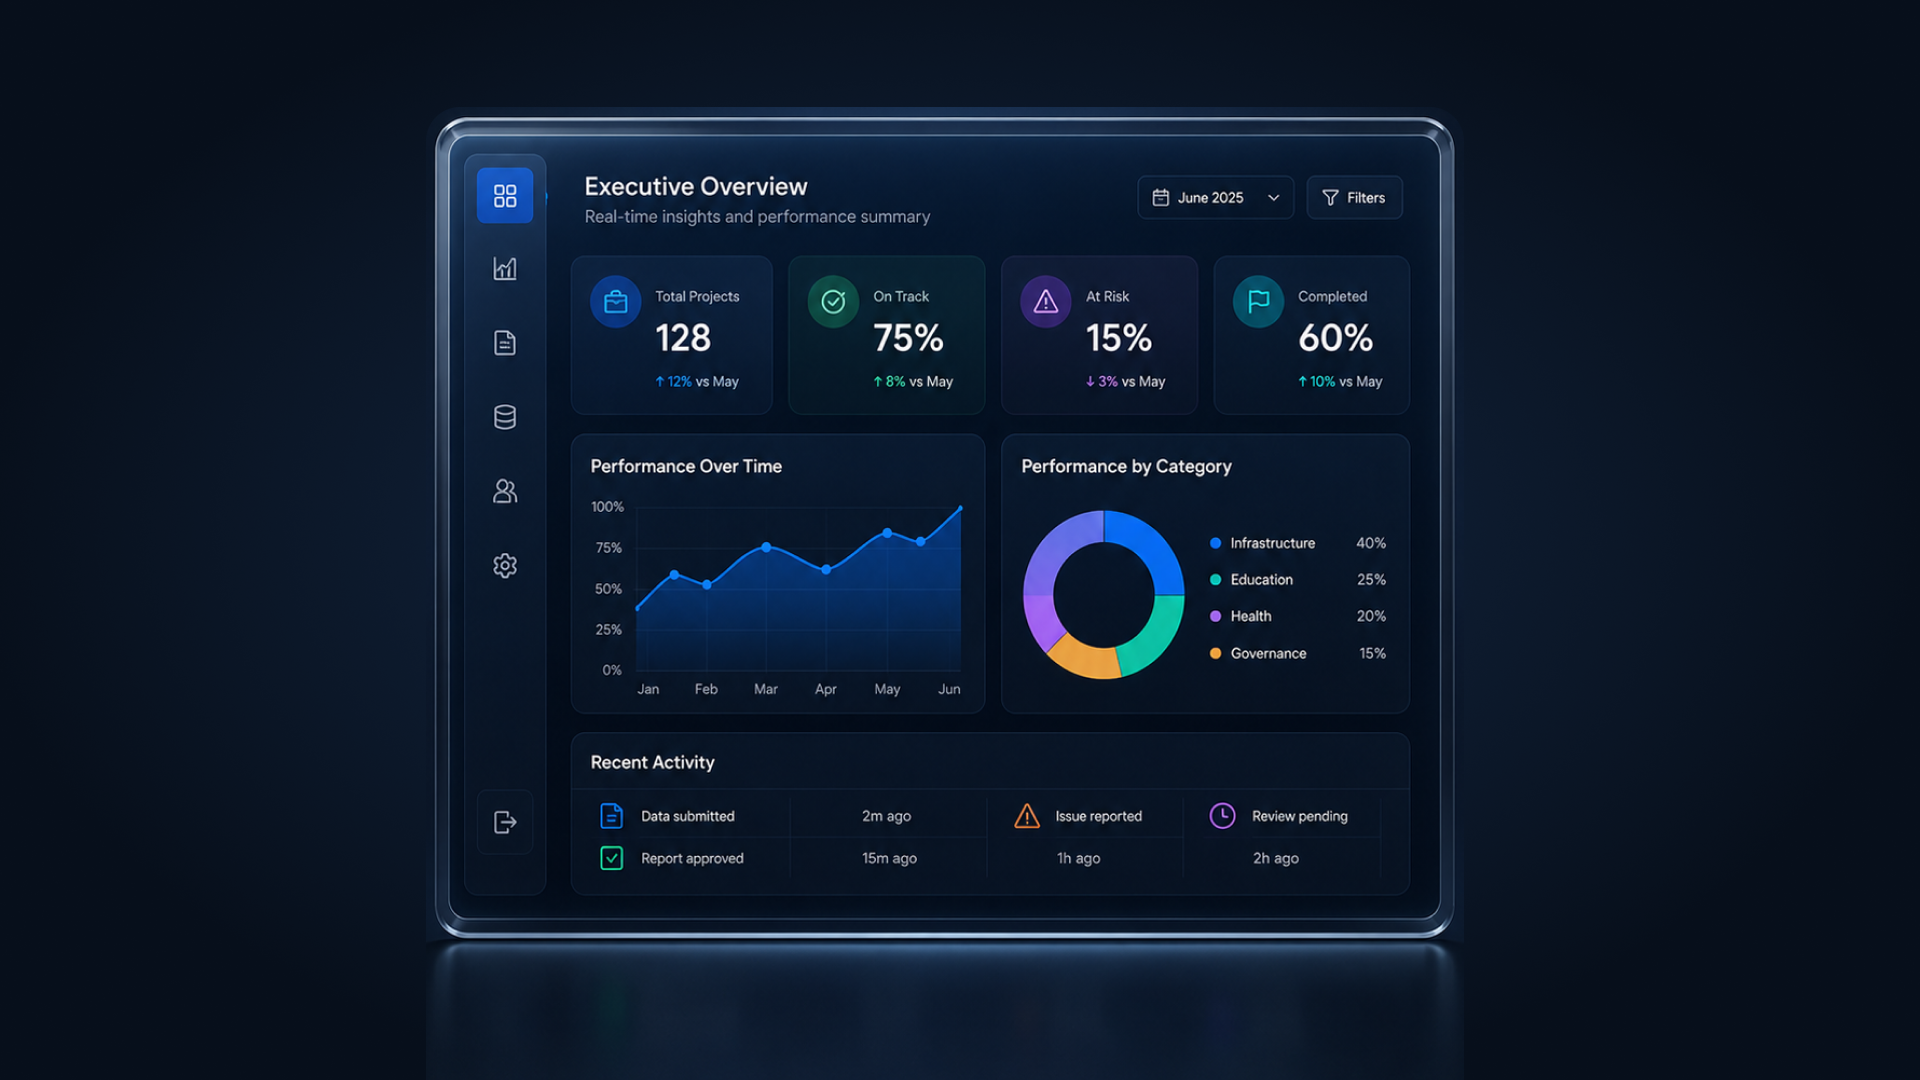
A good dashboard is not just a visual reporting tool. It is a decision layer.
A Dashboard Depends on the Data Behind It
A dashboard can look clean and professional while still showing information that is incomplete, outdated, duplicated, or difficult to trust.
This usually happens when data comes from different systems, spreadsheets, teams, or manual updates without clear validation. The dashboard may display the numbers faster, but faster reporting does not always mean better reporting.
Before building dashboards, organisations need to understand where data comes from, who owns it, how it is updated, and how accuracy is checked. Without this clarity, users may spend more time questioning the dashboard than using it.
Indicators Need Clear Definitions
Many dashboards fail because teams begin with charts before agreeing on what the numbers actually mean.
One department may define progress as completed activities. Another may define it as approved outputs. Leadership may expect outcome-level performance. When these definitions are not aligned, the dashboard creates confusion instead of clarity.
Strong dashboards need clear indicators, formulas, filters, reporting periods, categories, and data sources. Everyone should understand what each metric means and how it is calculated before it appears on screen.
More Charts Do Not Mean Better Insight
A dashboard with too many graphs, cards, tables, and filters can still fail to answer the most important question: what needs attention?
Good dashboards do not show everything. They show what matters.
Leadership may need risks, delays, and performance summaries. Managers may need progress by team, location, or activity. Field teams may need submission status or pending corrections.
Each view should be designed around the decision that user needs to make.
Dashboards Should Connect to Real Workflows
A dashboard should not sit outside the way teams actually work.
If users still collect data manually, verify updates through messages, prepare reports offline, and chase missing information separately, the dashboard is only showing the final output of a weak process.
Better dashboards connect with workflows. They show what is submitted, pending, approved, delayed, incomplete, or ready for review. This makes the dashboard part of the operating environment, not just a reporting screen.
Dashboards Need Ownership After Launch
Dashboards do not stay useful automatically.
Indicators change. Reporting needs evolve. Users require new access. Data sources are updated. If no one owns the dashboard after launch, it slowly becomes outdated.
Clear ownership is needed for data quality, access control, reporting changes, validation, and ongoing improvements. Without governance, even a well-designed dashboard can lose trust over time.
At Centangle, dashboard systems are approached through the full reporting environment. That means understanding data sources, workflows, indicators, users, and decision points before designing the visual layer.
Dashboards do not automatically create better decisions.
Clear data, defined indicators, connected workflows, role-based views, and strong ownership do.
Key Takeaways
- A Dashboard Depends on the Data Behind It
- Indicators Need Clear Definitions
- More Charts Do Not Mean Better Insight
- Dashboards Should Connect to Real Workflows
Final Thoughts
Lasting transformation comes from clear goals, honest process design, and technology chosen to support how your teams actually work—not the other way around. If this article resonated, we can help you translate insight into a practical roadmap.